
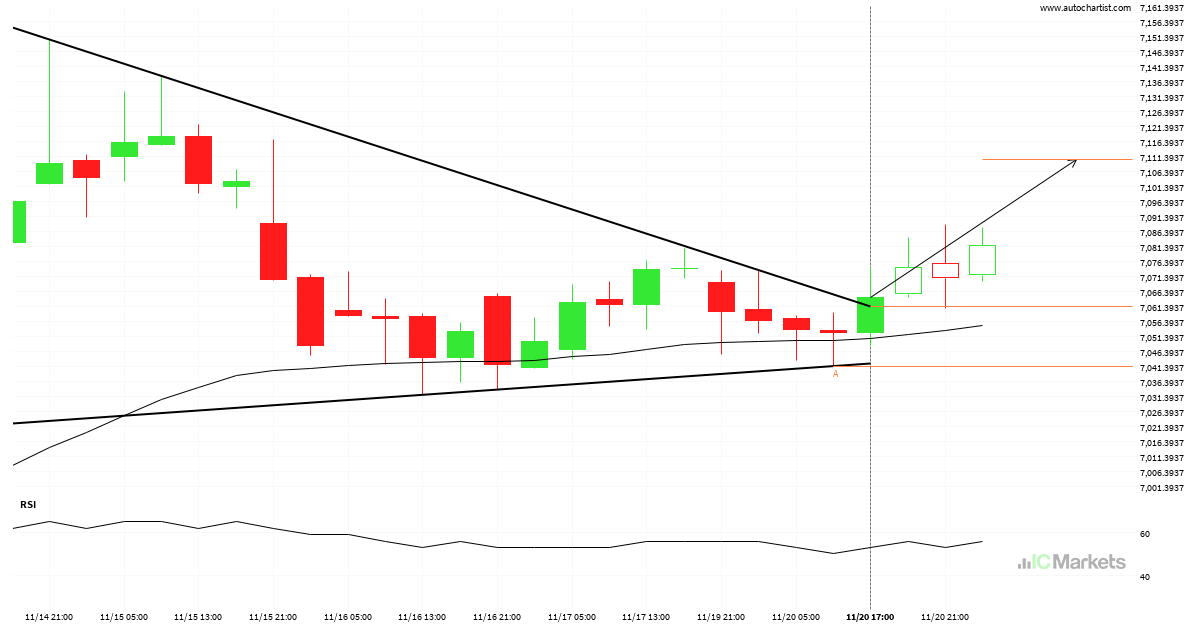
Should we expect a bullish trend on Australia 200 Index?
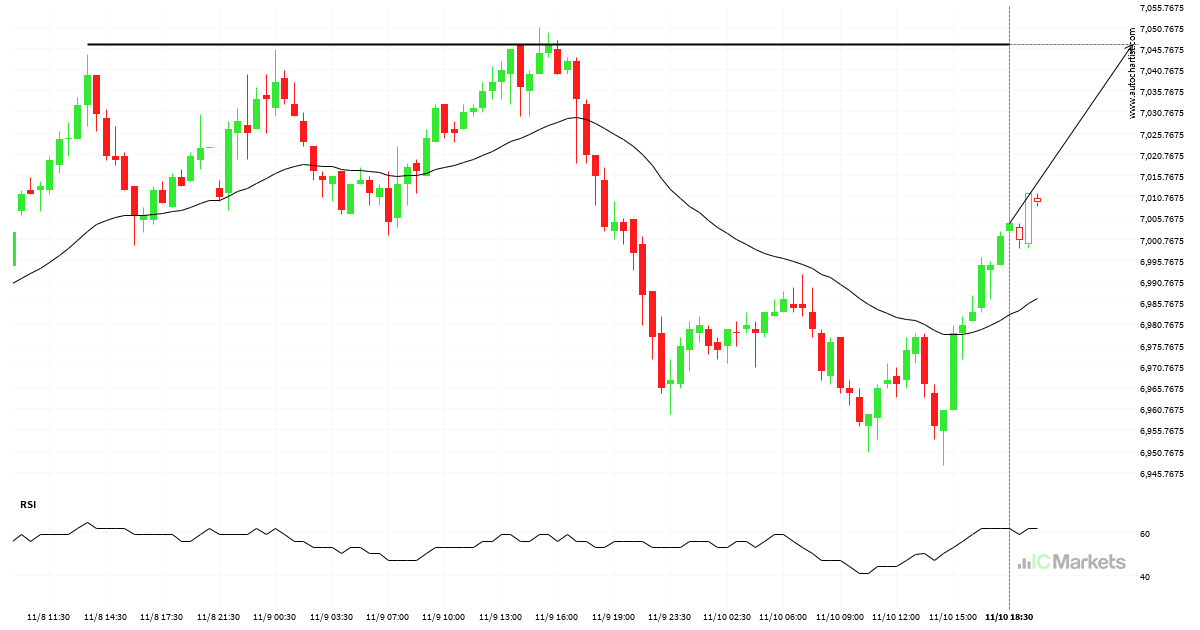
Pennant pattern identified on Australia 200 Index has broken through a resistance level with the price momentum continuing to move in an upward direction. A solid trading opportunity continues with the price expected to reach 7110.3585 in the next 14.
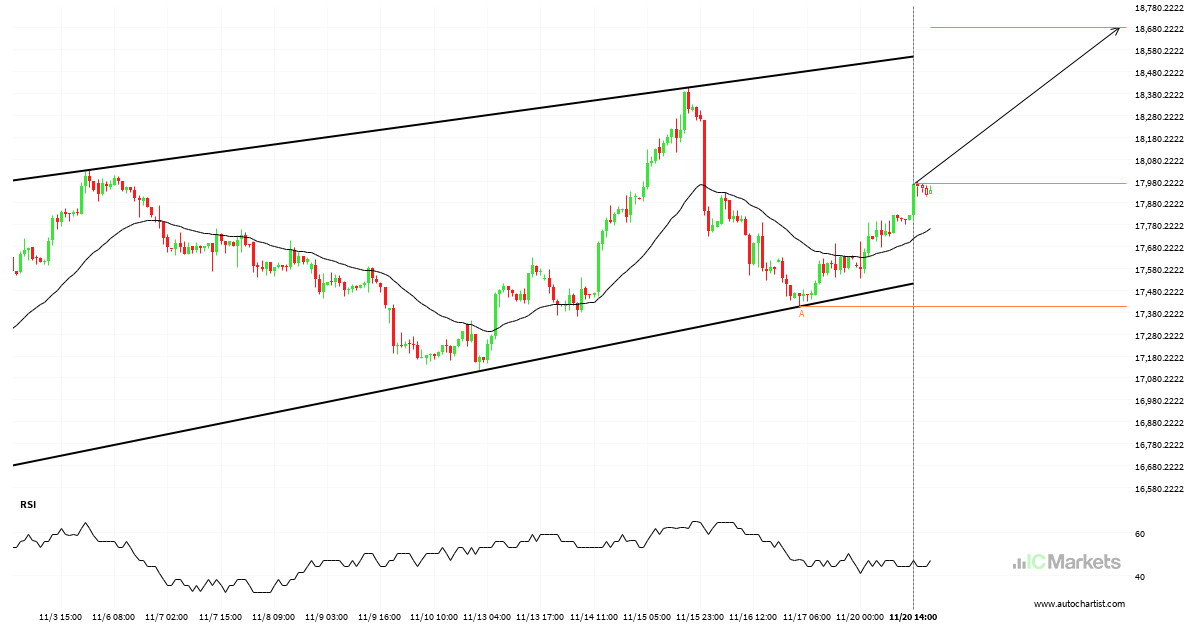
Hong Kong 50 Index approaching resistance of a Channel Up
An emerging Channel Up has been detected on Hong Kong 50 Index on the 1 hour chart. There is a possible move towards 18680.2757 next few candles. Once reaching support it may continue its bullish run or reverse back to current price levels.

FTSE China A50 Index – getting close to resistance of a Channel Down
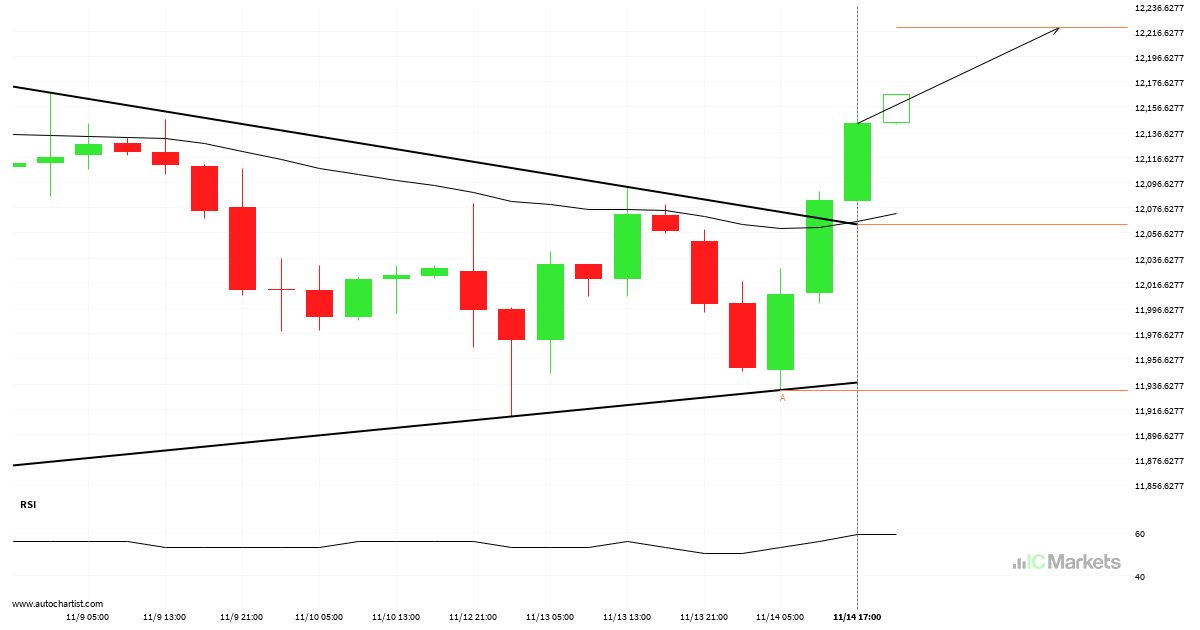
Emerging Channel Down detected on FTSE China A50 Index – the pattern is an emerging one and has not yet broken through support, but the price is expected to move up over the next few hours. The price at the time the pattern was found was 12011.61 and it is expected to move to 12150.4675.
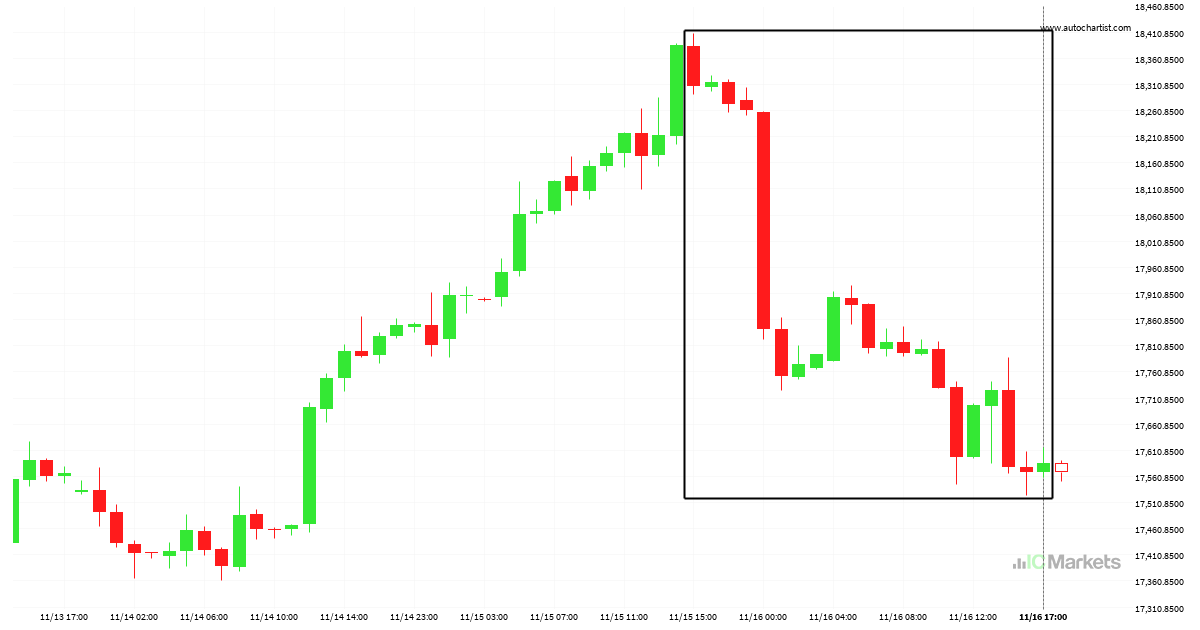
A day run-downward on Hong Kong 50 Index
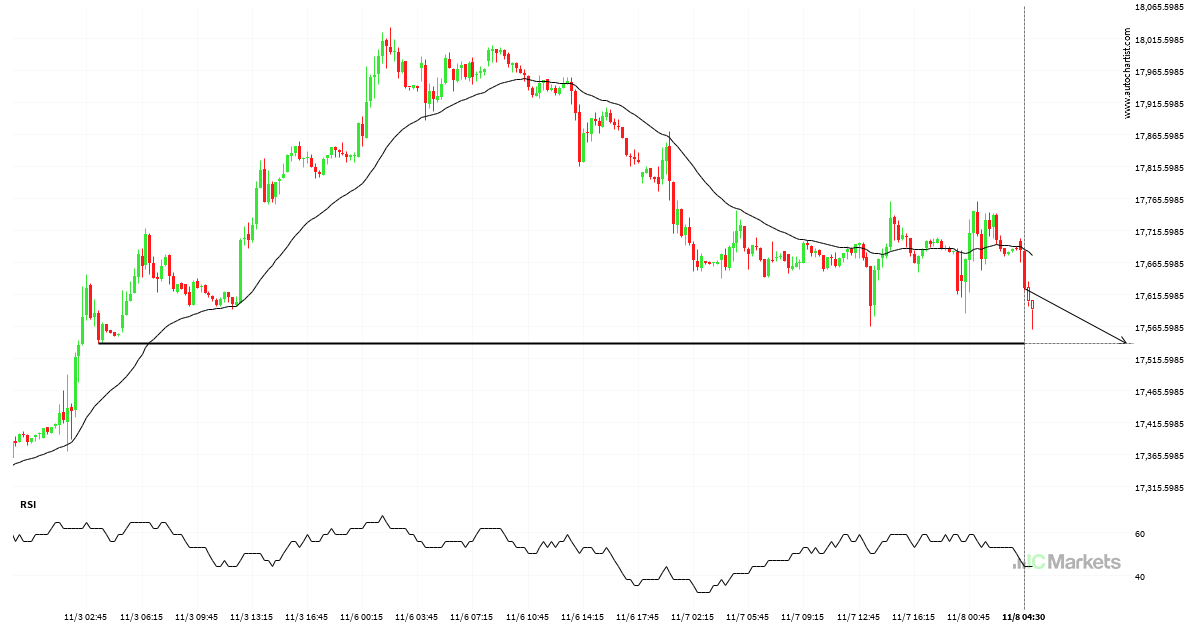
Hong Kong 50 Index hits 17585.5 after a 3.94% move spanning 2 days.
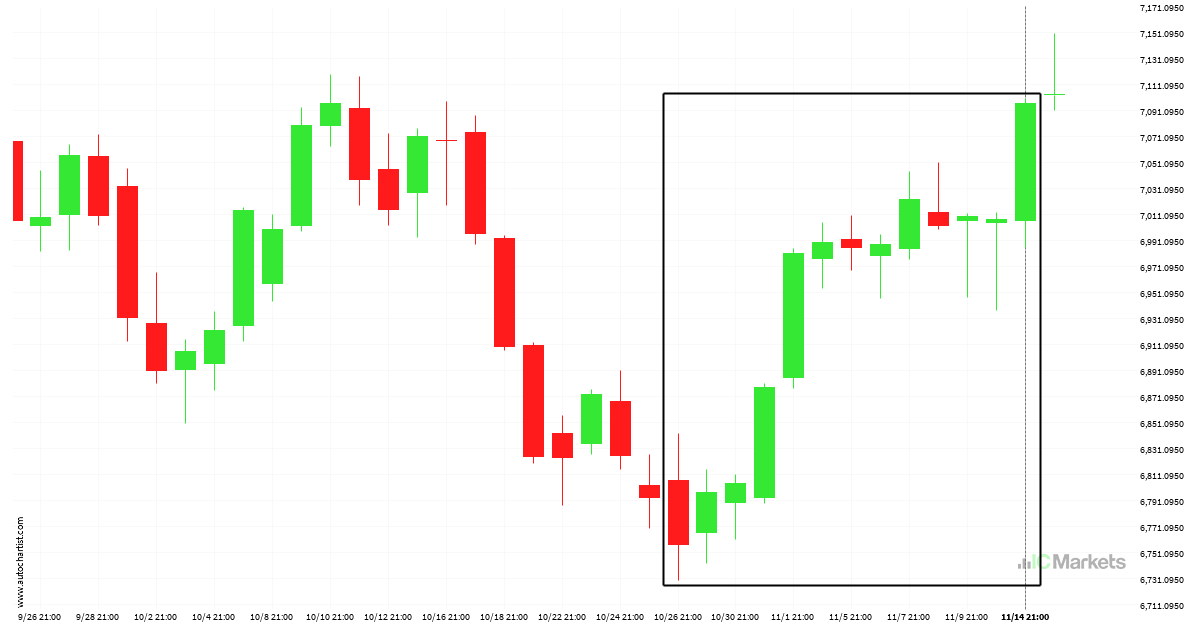
Did you miss this move on Australia 200 Index?
For those of you that don’t believe in trends, this may be an opportunity to take advantage of an exceptional 5.03% move on Australia 200 Index. The movement has happened over the last 20 days. For those trend followers among you, you may think about riding this possible trend.
Possibility of big movement expected on FTSE China A50 Index
The last 8 4 hour candles on FTSE China A50 Index formed a Triangle pattern and broken out through the pattern lines, indicating a possible bullish movement towards the price level of 12219.2758.
Breach of important price line imminent by Australia 200 Index
Australia 200 Index is moving towards a key resistance level at 7046.6099. Australia 200 Index has previously tested this level 3 times and on each occasion it has bounced back off this level. Is this finally the time it will break through?
Will Hong Kong 50 Index have enough momentum to break support?
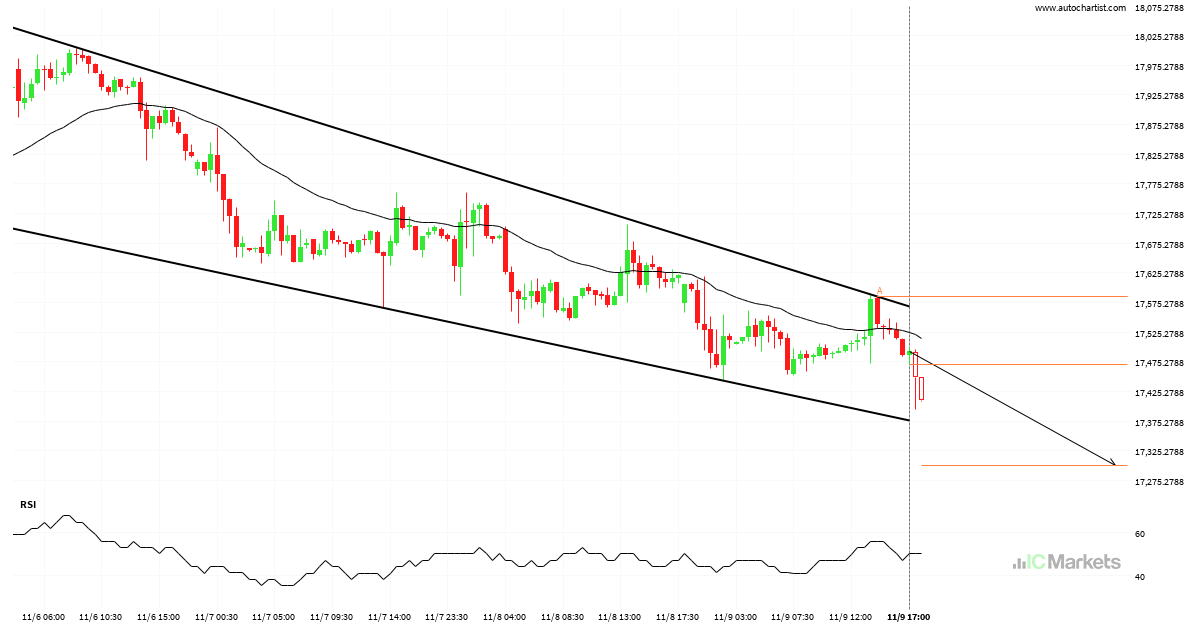
Hong Kong 50 Index was identified at around 17470.5 having recently rebounded of the resistance on the 30 Minutes data interval. Ultimately, the price action of the stock has formed a Channel Down pattern. This squeeze may increases the chances of a strong breakout. The projected movement will potentially take the price to around the […]
Breach of important price line imminent by Hong Kong 50 Index
Hong Kong 50 Index is approching a support line at 17539.5000. If it hits the support line, it may break through this level to conitnue the bearish trend, or it may turn around back to current levels.
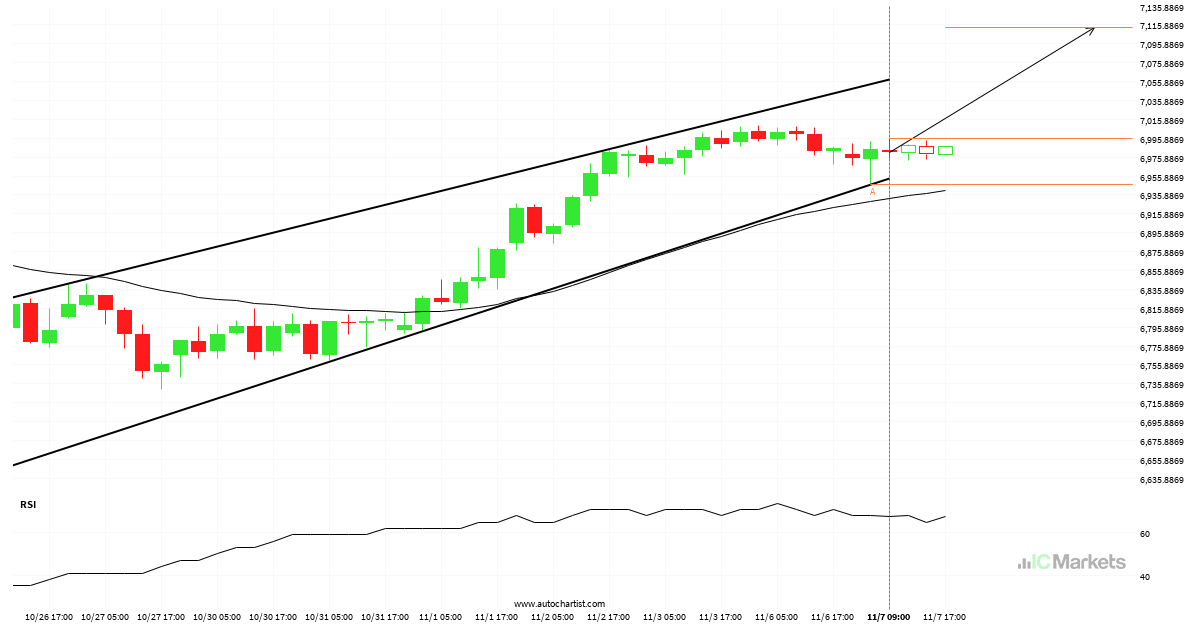
Australia 200 Index – getting close to resistance of a Channel Up
Australia 200 Index is approaching the resistance line of a Channel Up. It has touched this line numerous times in the last 13 days. If it tests this line again, it should do so in the next 2 days.